Data &
Technology
Research
Reports
Report Solutions
Reports Library
Actionable
Strategies
Free
Resources
Simple Backtest Calculator
Simple Seasonality Calculator
The Kelly Criterion Calculator
Sentiment Geo Map
Public Research Reports
Free Webinar
Pricing
Company
About
Meet Our Team
In the News
Testimonials
Client Success Stories
Contact
Log inLoginSign up
< BACK TO ALL REPORTS

Bond investors did this for only the 2nd time in 6 months

Jason Goepfert
2020-11-09
Bond funds suffered an outflow for only the 2nd week in the past 30, while stock funds have rarely seen inflows.

Investors still aren't showing much love for stocks, at least according to flows in mutual funds and ETFs. They still favor bonds, despite a recent blip.

The latest data from Lipper shows that investors finally pulled some money out of bond funds over the past week. That's only the 2nd outflow in the past 30 weeks.

Mutual fund and ETF flows into bonds

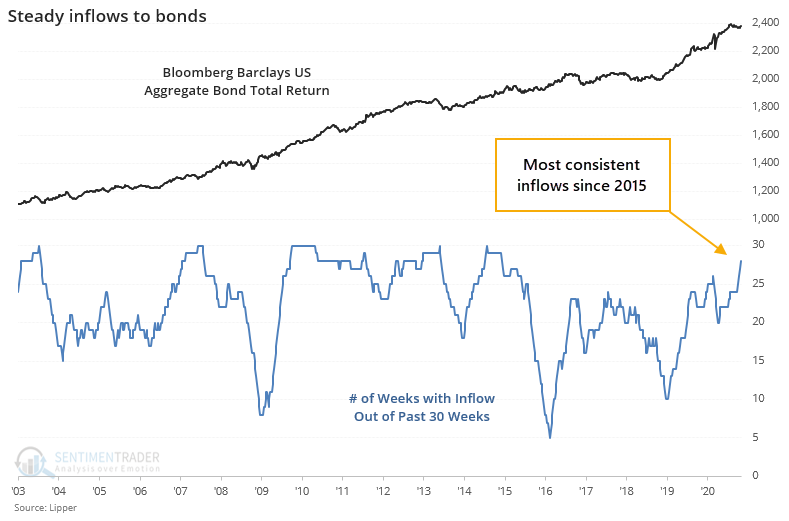
Stocks, on the other hand, have seen almost nothing but outflows over that time span. The consistency of flows between the two asset classes has never been more stark. 

The difference in flows moved to a record several weeks ago and continues to reach new highs. The handful of other times there were around 15 more weeks of inflows to bonds versus stocks, the bond/stock ratio tended to decline.


What else is happening

These are topics we explored in our most recent research. For immediate access with no obligation, sign up for a 30-day free trial now.

  • A look at flows into stock mutual funds and ETFs
  • What happens to the bond/stock ratio when there are consistent flows into bonds and out of stocks
  • There has been a record number of Up Volume breadth thrusts in 2020
  • On a shorter time frame, we're seeing a cluster of breadth thrusts similar to October

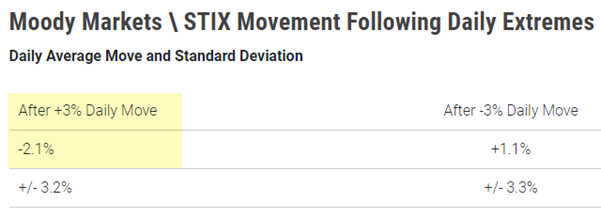
Stat Box

Last wee, the S&P 500 rallied more than 7% and closed at an all-time weekly closing high. That's its best-ever weekly gain to set a new high. There have been 6 other times it rallied 5% or more to set a new record, typically leading to a little more short-term strength. Over the next 3 months, 2 of the signals showed more gains, while 4 suffered losses as buyers became exhausted.

Sentiment from other perspectives

We don't necessarily agree with everything posted here - some of our work might directly contradict it - but it's often worth knowing what others are watching.

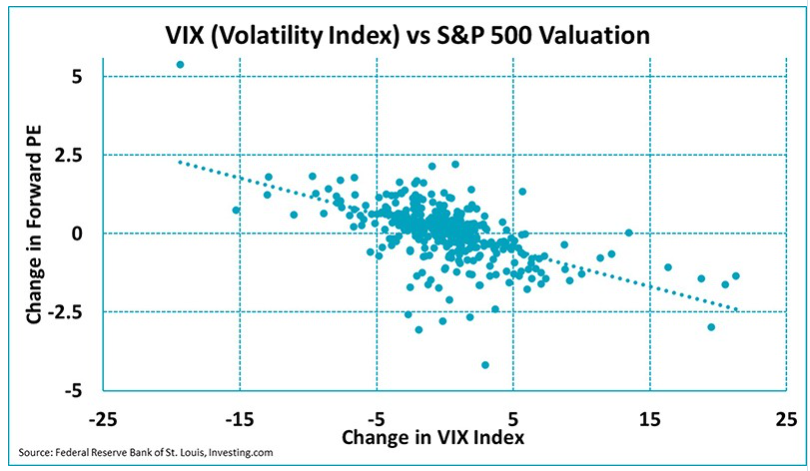
1. If the VIX keeps falling, then it suggests investors will give stocks higher multiples - Robeco

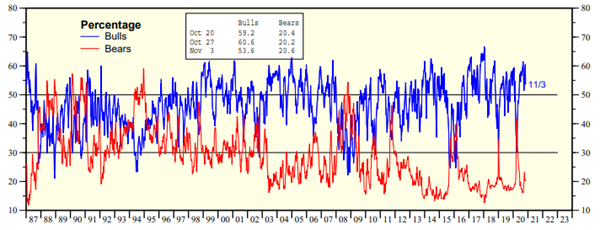
2. Newsletter writers are pretty optimistic that stocks will keep rallying - Yardeni

3. When traders push small tech stocks far above their usual daily gain, forward returns were weak - Traders' Insight

DATA &
TECHnologies
IndicatorEdge
‍
BackTestEdge
‍
Other Tools
‍
DataEdge API
RESEARCH
reports
Research Solution
‍
Reports Library
‍
actionable
Strategies
Trading Strategies
‍
Smart Stock Scanner
‍
FREE
RESOUrCES
Simple Backtest
Calculator
Simple Seasonality
Calculator
The Kelly Criterion
Calculator
Sentiment Geo Map
‍
Public Research Reports
‍
Free Webinar
COMPANY
‍
About
‍
Meet our Team
‍
In the News
‍
Testimonials
‍
Client Success Stories
Pricing
Bundle pricing
‍
Announcements
‍
FAQ
© 2024 Sundial Capital Research Inc. All rights reserved.
Setsail Marketing
TermsPrivacyAffiliate Program
Risk Disclosure: Futures and forex trading contains substantial risk and is not for every investor. An investor could potentially lose all or more than the initial investment. Risk capital is money that can be lost without jeopardizing ones’ financial security or life style. Only risk capital should be used for trading and only those with sufficient risk capital should consider trading. Past performance is not necessarily indicative of future results.

Hypothetical Performance Disclosure: Hypothetical performance results have many inherent limitations, some of which are described below. No representation is being made that any account will or is likely to achieve profits or losses similar to those shown; in fact, there are frequently sharp differences between hypothetical performance results and the actual results subsequently achieved by any particular trading program. One of the limitations of hypothetical performance results is that they are generally prepared with the benefit of hindsight. In addition, hypothetical trading does not involve financial risk, and no hypothetical trading record can completely account for the impact of financial risk of actual trading. for example, the ability to withstand losses or to adhere to a particular trading program in spite of trading losses are material points which can also adversely affect actual trading results. There are numerous other factors related to the markets in general or to the implementation of any specific trading program which cannot be fully accounted for in the preparation of hypothetical performance results and all which can adversely affect trading results.

Testimonial Disclosure: Testimonials appearing on this website may not be representative of other clients or customers and is not a guarantee of future performance or success.