
Average True Range Volatility Reversal Buy Signal Concept

Developed by J. Welles Wilder, the average true range (ATR) is a technical analysis indicator that shows how much an asset moves, on average, during a given time frame. The ATR is a more realistic way to measure volatility because it considers any gaps in the price movement of a security. One can find the indicator in most charting applications with a standard moving average period of 14 days.
Suppose you're interested in learning more about the indicator. In that case, a simple google search will provide plenty of material.
Today's note aims to share a concept that uses a derivative of the average true range indicator to identify a hypothetical buy signal when volatility reverses from a period of expansion to contraction.
The trading signal is based on the following formula.
AVERAGE TRUE RANGE SPREAD
ATR = 5-Day Average True Range ;
ATR2 = 20-Day Average True Range ;
If ATR2>0 then
Spread = ((ATR/ATR2)-1)*100;
THE CONCEPT
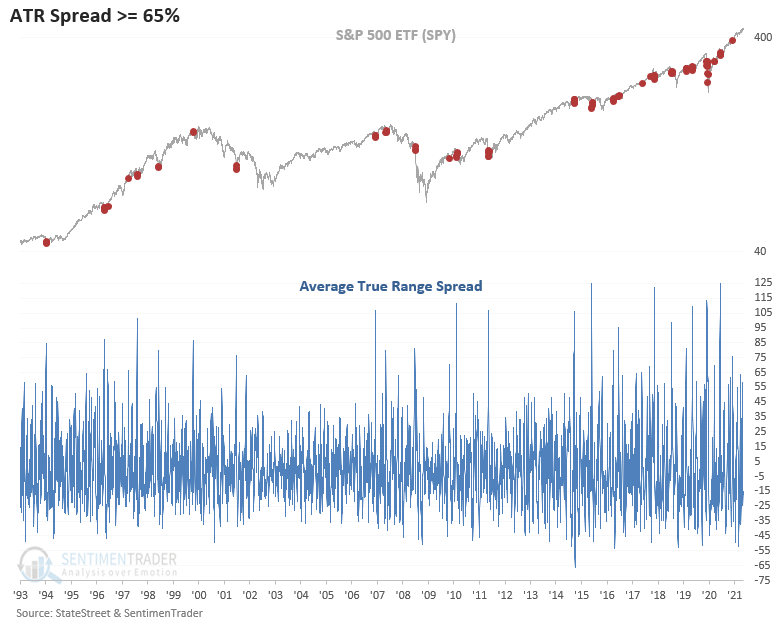
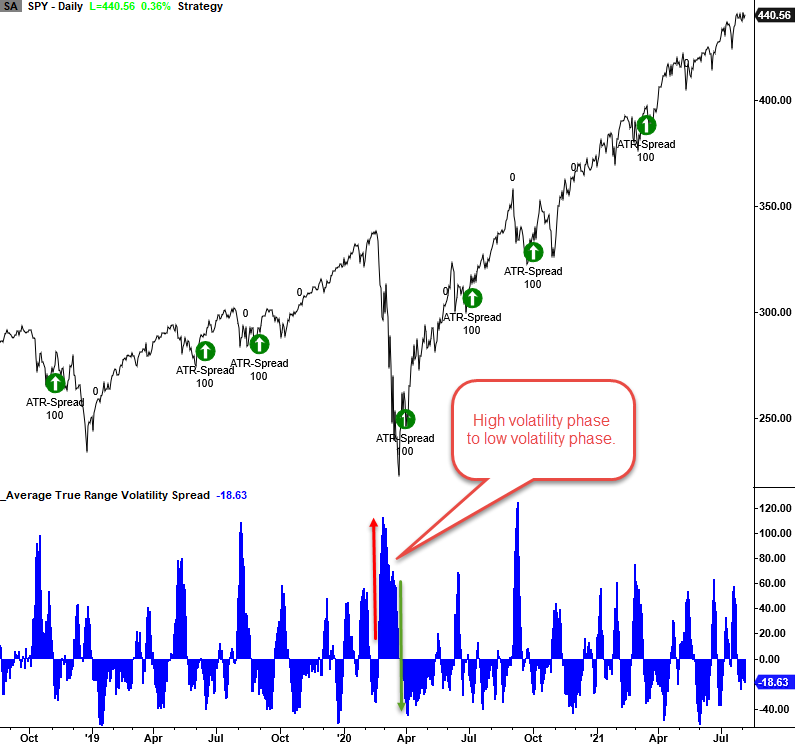
The average true range spread signal identifies when a stock, ETF, or commodity reverses from a period of high volatility to low volatility in a user-defined number of days. The model will issue an alert based upon the following conditions.
SIGNAL CRITERIA FOR THE S&P 500 ETF (SPY)
Edit: The signal criteria text has been modified from the original note to make it easier to understand.
1.) When the ATR spread crosses above the reset input value( 65%), the reset condition is active. The reset condition must occur for a new signal to trigger.
2.) When the ATR spread < the reset input value (65%), start a day's since true count.
3.) When the ATR spread crosses below the buy level input value (-26.5%), start days since true count.
4.) If the first days since true count is <= 25,
and the second days since true count <= 5,
and the 5-day rate of change for the underlying security is greater than zero,
and the underlying security is not at a 42-day high, then buy.
Typically, volatility events occur when an asset undergoes a correction in price. On occasion, the spread will increase when the price of a stock, ETF, or commodity rises on a news-driven event.
HISTORICAL CHART EXAMPLE
CURRENT DAY CHART
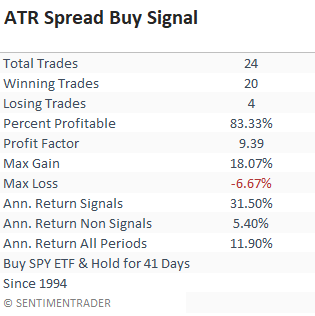
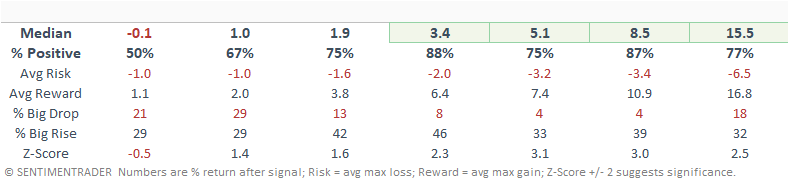
TRADING STATISTICS
The trading statistics in the table below reflect the optimal days-in-trade holding period of 41 days. When I run optimizations for trading signals, I cap the max number of days at 42.
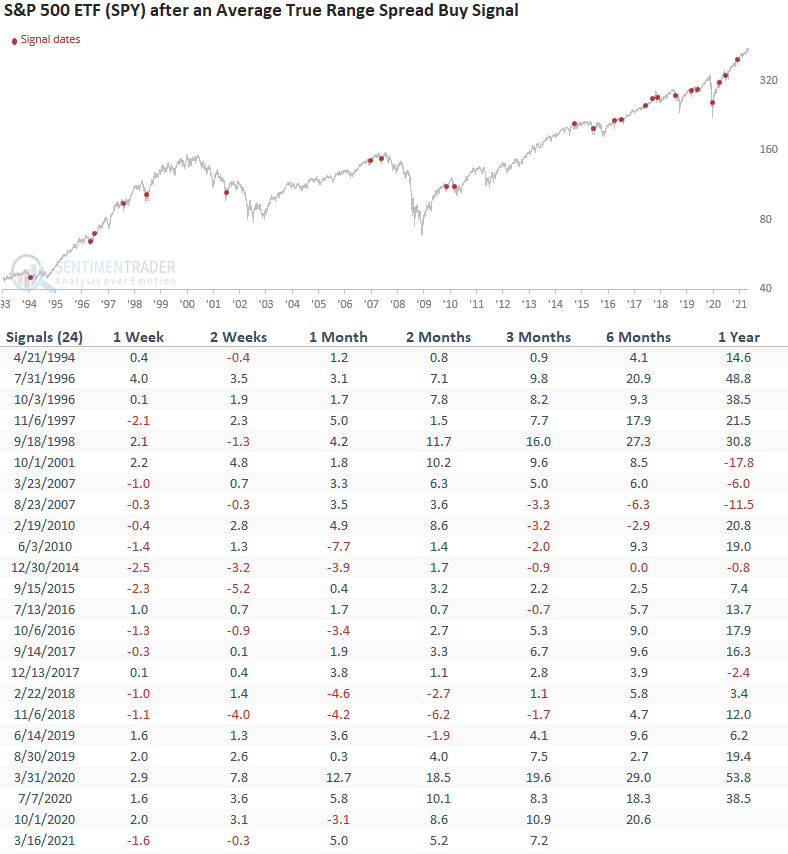
HOW THE SIGNALS PERFORMED
Besides the 1-week timeframe, performance looks solid with several notable z-scores. I suspect the 1-week numbers are a reflection of a choppy bottoming environment. I would also note that the 2-month timeframe had 16 consecutive winning trades between 1994 and 2017.
The average true range concept is a flexible approach that one can use across various asset classes. Depending on the asset, the spread parameters might be slightly different.