
A Simple Lesson in Combining Our Macro Index and Price

At the end of July, our Macro Index Model dropped from above 0.70 to below 0.70. Generally speaking, a reading of 0.70 or above is considered "favorable" for the stock market. While a drop below 0.70 does necessarily constitute a "sell everything and head for the hills" type of signal, it nevertheless is an unfavorable development, as it knocks another pillar out from under the market.
I want to show you a simple method incorporating the Macro Index Model with price action in this piece. For the record, this method is presented solely for educational purposes and should not be considered as investment advice or as a trading recommendation.
THE BACKGROUND
To make a long story short - and to avoid revisiting a painful time from my past - let's just say I started as a "seat of the pants" kind of trader, trusting my "keen instincts" to determine when to buy and sell. Let's also just say that after trading by the seat of my pants for a period of time - and getting my, um, backside, burned so many times, I became a trader who "couldn't sit down for long periods of time" so to speak. Luckily, it was from that experience that I developed into primarily a trend-following type of trader.
I love indicators, oscillators, lines on charts, and so on. But I also have learned that when you are in a trade, the only thing that really matters is price. If price moves in your favor, you make money and vice versa. However, not everyone is programmed to trade off price alone (Hi, my name is "Jay."). As a result, many of us evolve into hybrid traders - i.e., we combine different factors in something of a "weight of the evidence" fashion to guide our trading. So, let's talk about a simple and useful model that does just that.
THE MACRO/INDEX PRICE COMBINATION
We will essentially create a model with two inputs:
- If the Macro Index Model is >= 0.70 then Model Input1 = 1 else Model Input1 = 0
- If the S&P 500 Index is above its 10-month average then Model Input2 = 1 else Model Input2 = 0
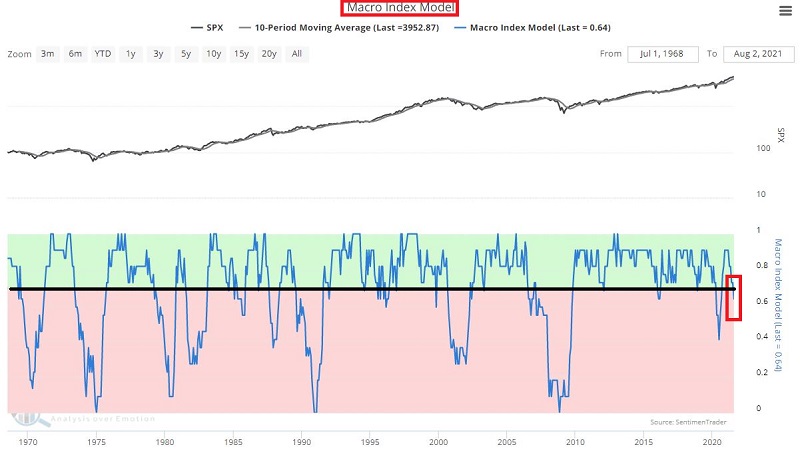
The chart below displays the history and current status of our Macro Index Model. You can see the latest drop below 0.70 highlighted in the red box on the far right-hand side of the chart. So, Model Input1 = 0.
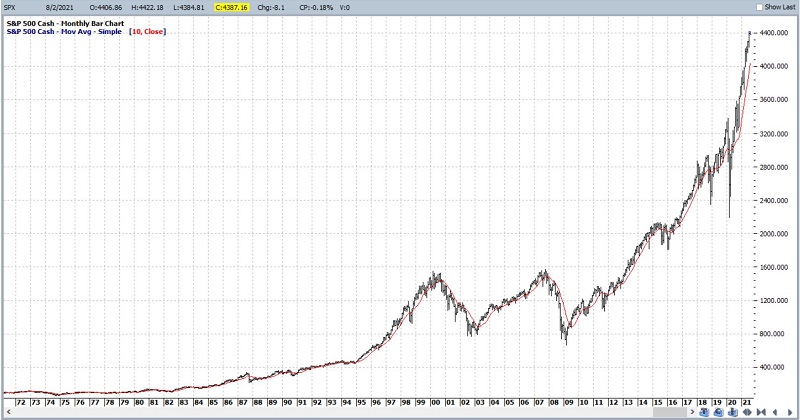
The chart below (courtesy of ProftSource) displays a monthly chart of the S&P 500 Index versus its 10-month moving average. You can see that - for now - the S&P 500 Index remains well above its 10-month average. So Model Input2 = 1.
When we combine these two simple monthly indicators, our model can read 0, +1, or +2. At the end of July, the current reading fell from +2 to +1. What does this imply for the market and investors? Let's take a closer look at the possibilities.
+2 READINGS
The chart below displays the cumulative % return for the S&P 500 Index if held long ONLY during those months when the previous month ended with:
- BOTH the Macro Index Model >= 0.70 AND the S&P 500 Index > it's 10-month moving average, i.e., a model reading of +2.
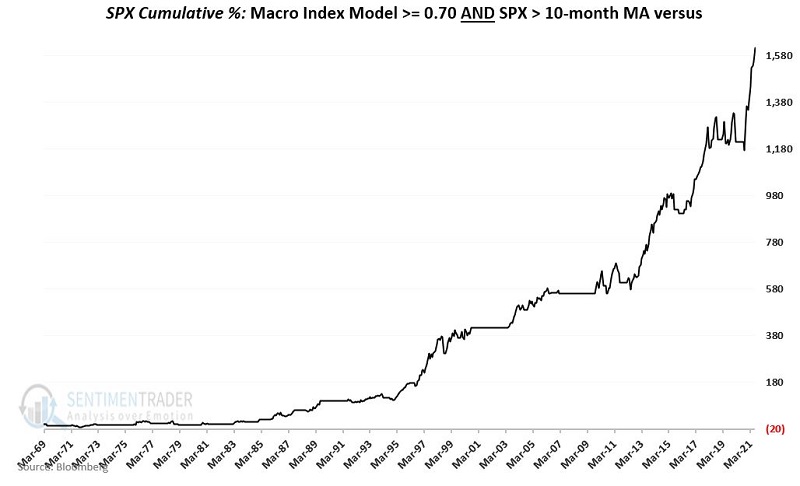
The steady "lower left to upper right" (or LLUR, as I like to call it) nature of the equity curve suggests that investors can typically sleep well when both model inputs are favorable. The maximum drawdown (using monthly data) was -15.6% (versus -52.6% for buying and holding the S&P 500 Index).
+1 READINGS
The chart below displays the cumulative % return for the S&P 500 Index if held long ONLY during those months when the previous month ended with:
- EITHER the Macro Index Model >= 0.70 OR the S&P 500 Index > its 10-month moving average, i.e., a model reading of +1, but NOT both.
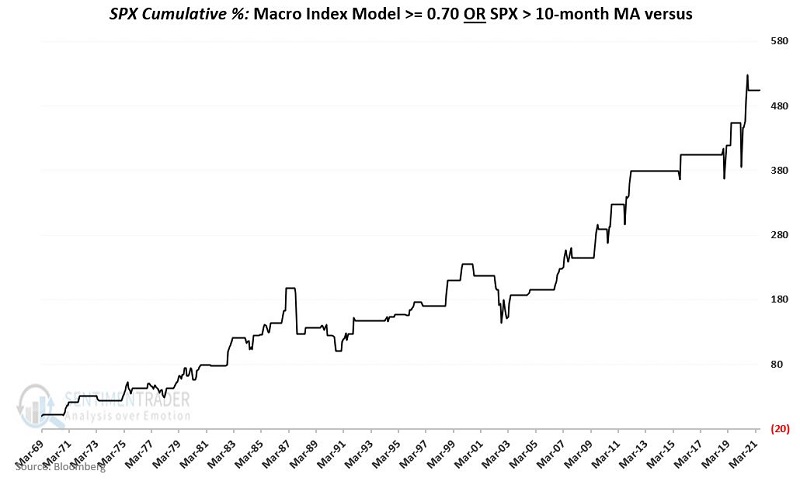
The overall trend was good, but there were some significant price shocks along the way (including 1987, 1990, 2002, 2018, and 2020). The maximum drawdown (using monthly data) was -32.4% (versus -52.6% for buying and holding the S&P 500 Index).
ALL READINGS > 0
The chart below displays the cumulative % return for the S&P 500 Index if held long ONLY during those months when the previous month ended with:
- EITHER the Macro Index Model >= 0.70 AND/OR the S&P 500 Index > its 10-month moving average, i.e., a model reading of +1.
The implication here is that as long as at least one of the two indicators is favorable, we are in the market.
The chart below displays the cumulative % return for the S&P 500 Index if held long when this model is > 0, i.e.:
- When EITHER the Macro Index Model > 0.70 AND/OR the S&P 500 Index > 10-month moving average
- Versus using a buy-and-hold approach
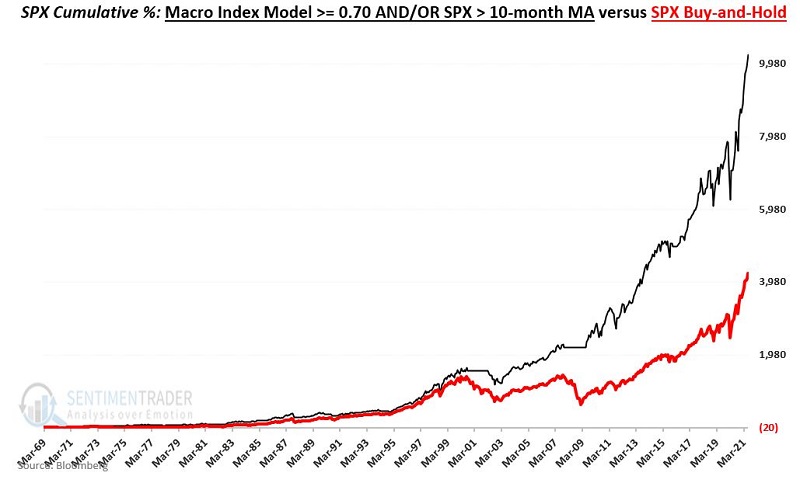
NOTE: When the model = 0, no gain or loss is added to or subtracted for that month from the black line in the chart below. It simply remains flat. In real-world practice, an investor would presumably invest in something to earn interest while out of the market.
For the record:
- Model > 0 cumulative SPX return = +10,232% (with no interest earned while out of the market)
- S&P 500 Index Buy-and-Hold cumulative return = +4,230%
READINGS = 0
As you may have surmised by now, the real trouble comes when BOTH fundamentals (Macro Index Model) AND price action (SPX < 10-month average) are unfavorable.
The chart below displays the cumulative % return for the S&P 500 Index if held long ONLY during those months when the previous month ended with:
- BOTH the Macro Index Model < 0.70 AND with the S&P 500 Index < its 10-month moving average, i.e., a model reading of 0
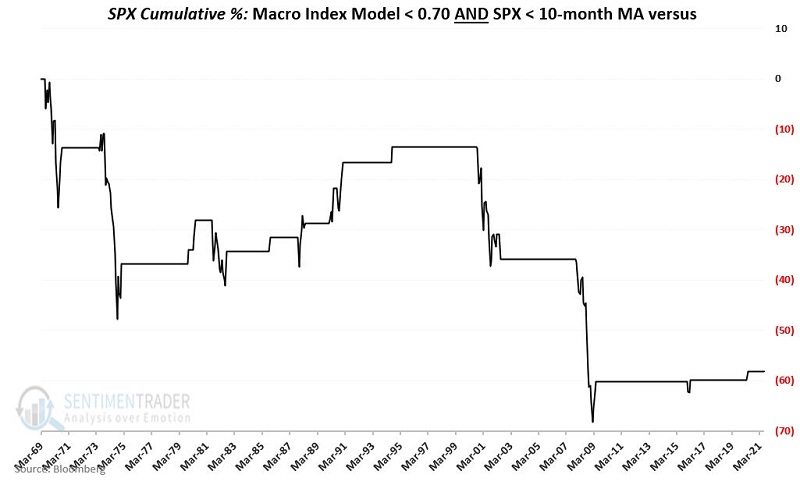
As you can see in the chart above, the stock market does not always decline when both factors are unfavorable. At the same time, the bulk of the most significant bear markets occurred during these times.
The S&P 500 Index has lost -58.1% since March of 1969 when BOTH fundamental, and price factors were unfavorable.
SUMMARY
With the S&P 500 Index still well above its 10-month moving average, this simple model now holds a reading of +1. Based on the results above, an investor might:
- Continue to give the stock market the benefit of the doubt
- But at the same time, be prepared for a potentially significant price shock
Generally speaking:
- If BOTH price AND fundamentals are favorable, the probabilities favor a bullish stock market
- If EITHER price OR fundamentals are favorable, there is a good chance that the stock market can perform well
- IF NEITHER price NOR fundamentals are favorable, there is no guarantee that the stock market will decline. However, that is when most major bear market activity in the past 50+ years has occurred.