
A Historic Streak of Tepid Energy Trends

Energy stocks enjoyed a historic thrust off their low, following a complete give-up among investors.
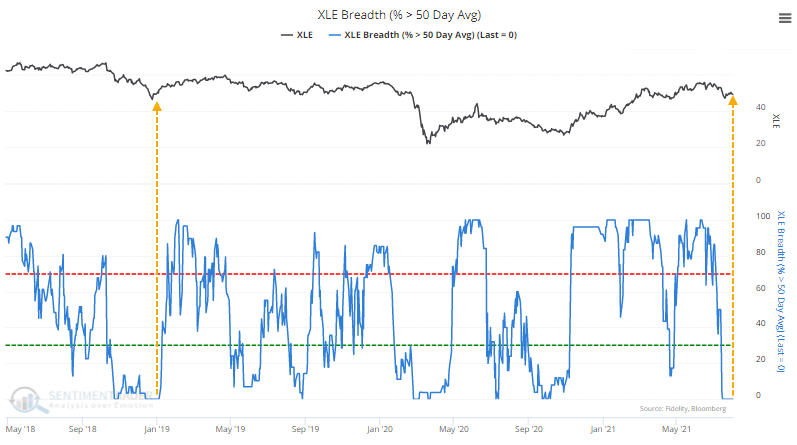
For the past few weeks, they've been stuck in neutral. While many are still holding above their long-term trends, none of them have managed to close above their medium-term 50-day moving averages for three straight weeks.
This is the longest stretch since the end of 2018. Over 70 years, this is now tied for the 4th-longest streak without a single stock in a medium-term uptrend.
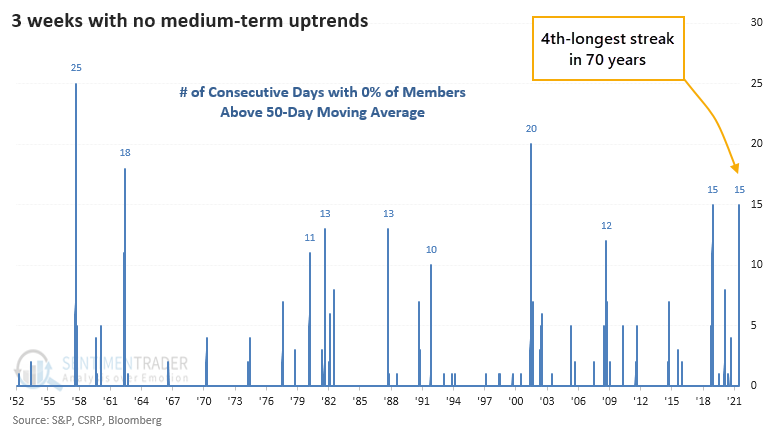
Energy stocks suffered a similar bout of medium-term failure at the end of 2018, but before that, there were only three other comparable stretches since 1952.
A WASHOUT SIGNAL...MOSTLY
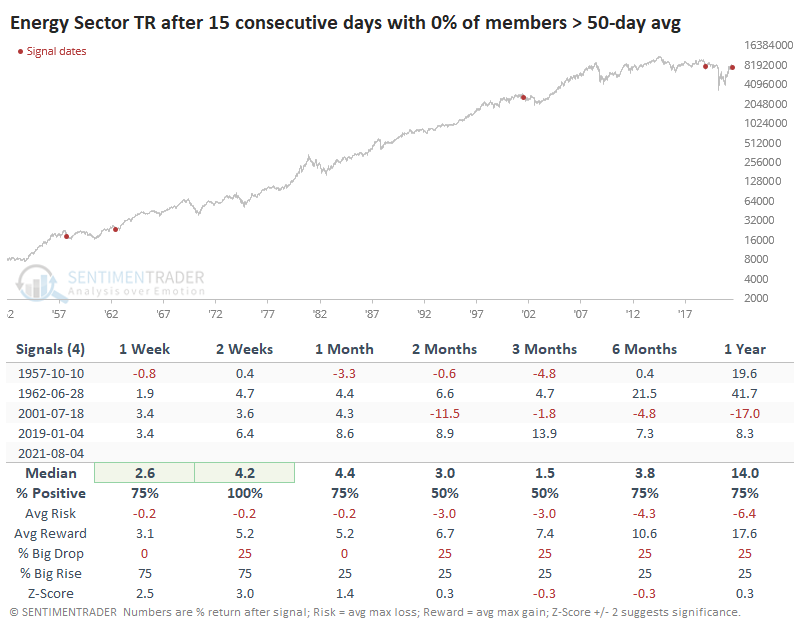
The other four saw the sector rally over the next couple of weeks, but then it faltered a couple of times. The 2001 occurrence was the only one that ended up leading to a protracted downtrend, though the 2019 signal did eventually lead to the pandemic crash.
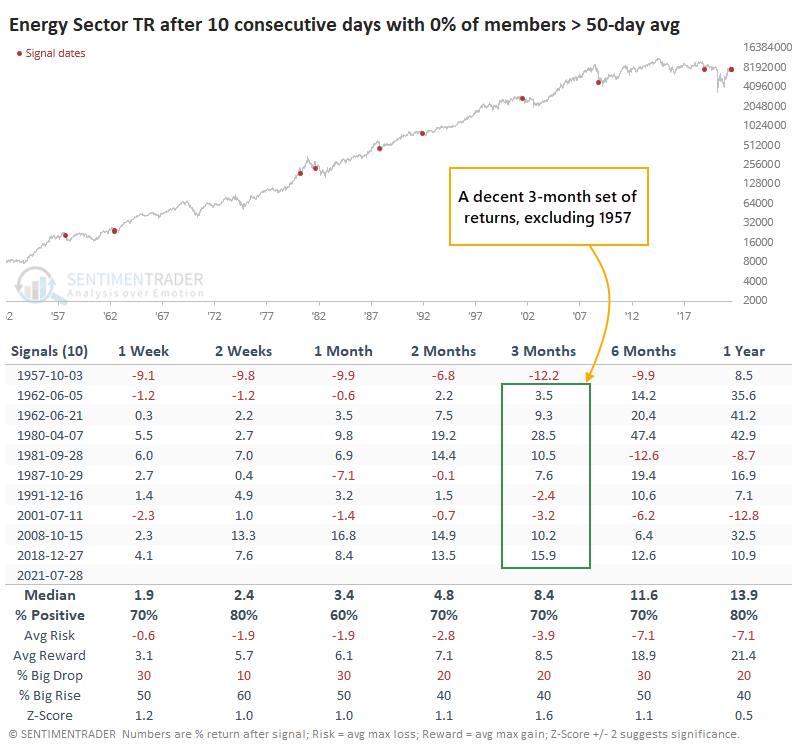
If we relax the parameters to look for streaks of 10 consecutive days with no energy stocks trading above their 50-day averages, we continue to see mostly positive returns in the week and months ahead. Only 2 of the 10 signals preceded losses over the next couple of weeks, and since 1960, none of them led to a loss of more than -3.5% over the next three months.
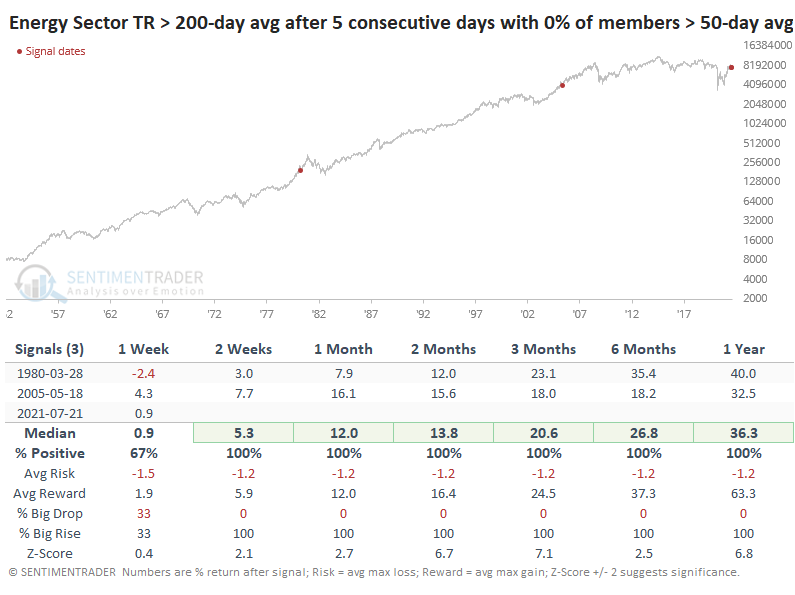
This is only the 3rd signal that saw even 5 consecutive days with no medium-term uptrends while the Energy sector was still trading above its 200-day moving average. We cannot read much into a sample size of two, but both preceded massive gains.
With another hit on Wednesday, Energy stocks haven't been able to recreate the sense of interest among buyers they enjoyed for most of the past eight months. Longer-term indicators aren't showing major oversold conditions, with the exception of the McClellan Summation Index, and there is a still-impressive 70% of members trading above their 200-day averages. But with weakness over the past few weeks, some of the medium-term ones, like the percentage of members above their 50-day averages, are signaling a decent risk/reward setup over the short- to medium-term.