Data &
Technology
Research
Reports
Report Solutions
Reports Library
Actionable
Strategies
Free
Resources
Simple Backtest Calculator
Simple Seasonality Calculator
The Kelly Criterion Calculator
Sentiment Geo Map
Public Research Reports
Free Webinar
Pricing
Company
About
Meet Our Team
In the News
Testimonials
Client Success Stories
Contact
Log inLoginSign up
< BACK TO ALL REPORTS

A Historic Spread in Big Stocks in Medium Term Uptrends

Jason Goepfert
2021-08-10
Many more Nasdaq 100 stocks have been trading above their 50-day moving averages than have stocks within the broader Nasdaq Composite index. The spread between them is now among the widest in 20 years.

Since the speculative peak in February, the stock market has become more bifurcated between winners and losers. That's normally a bad sign for the overall market, but 2021 has steamrolled every "bad sign" so far.

This winner-vs-everyone-else divergence is especially evident on the Nasdaq. In recent days, more than 70% of stocks included in the Nasdaq 100 index have closed above their 50-day moving averages. But within the broader Nasdaq Composite index, fewer than 40% of stocks are above those trendlines.

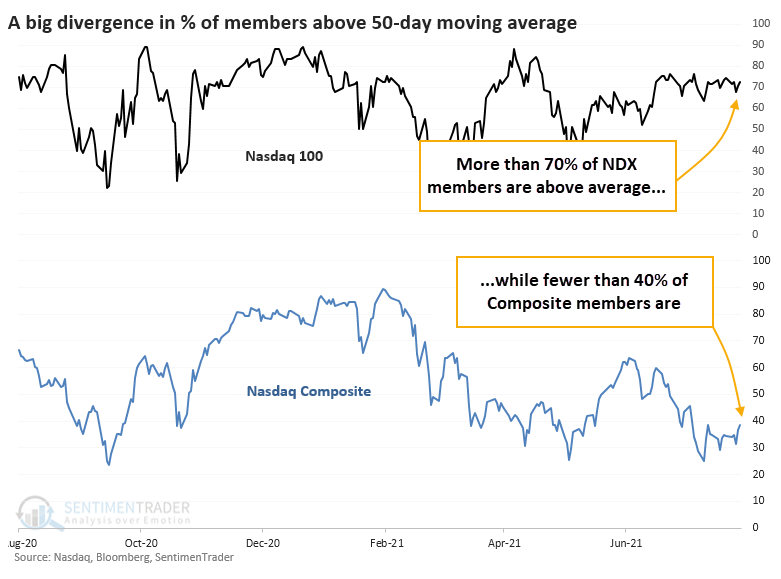
There are 102 stocks in the Nasdaq 100, and they have a median market capitalization of $58 billion. There are 3,423 securities in the Nasdaq Composite, with a median market cap of $471 million. Many of the smaller stocks in the broader Composite are dragging the internal breadth figures lower.

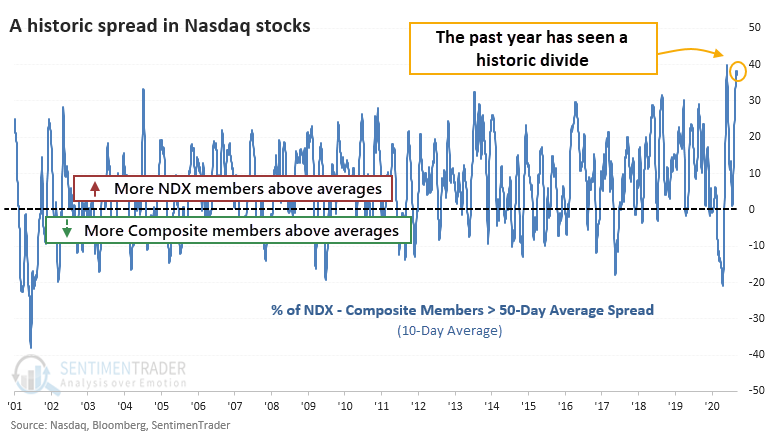
NEAR-RECORD SPREAD IN BREADTH

The 10-day average of the spread in breadth between those indexes is now among the widest in 20 years.

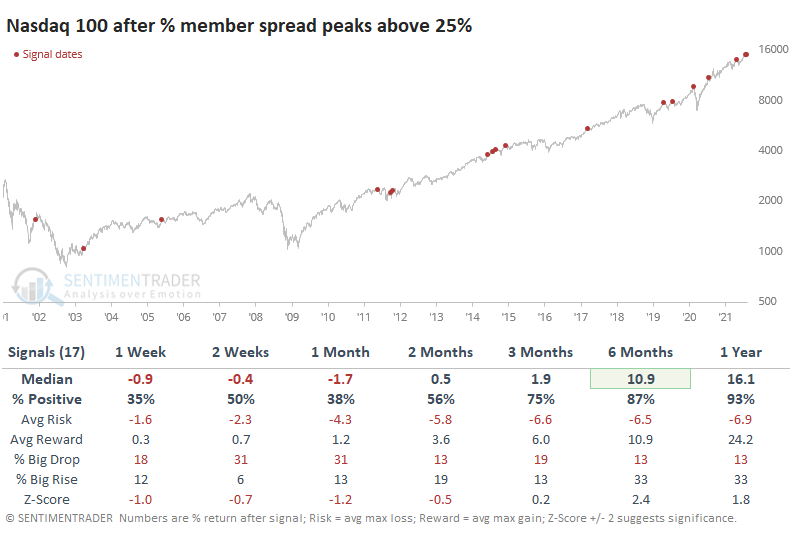
After other peaks in the spread, the Nasdaq 100 suffered some short-term pain but recovered nicely longer-term.

The same goes for the Composite.

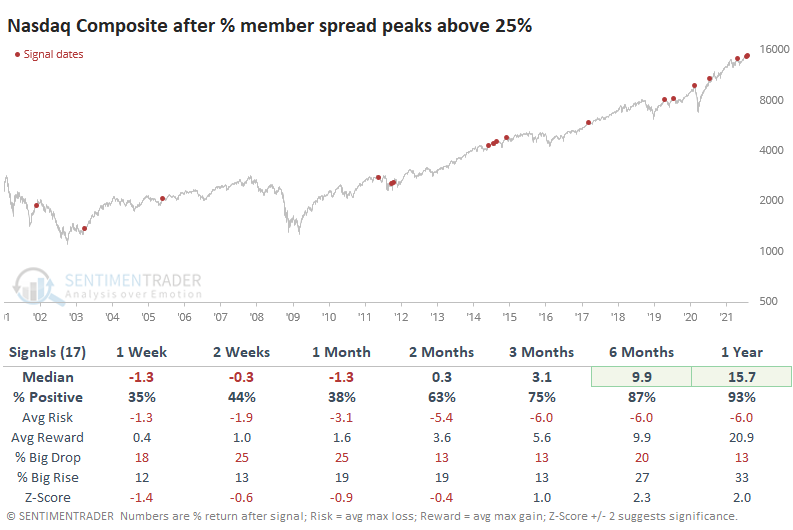
Like the Nasdaq 100, the Composite tended to show weak returns in the short-term but strong long-term returns thanks to the dominant bull market during most of the study period.

A BLOW-OFF SIGNAL

Looking at the ratio between them, these extremes in the medium-term trends tended to coincide with shorter-term blowoff peaks in the Nasdaq 100 to Nasdaq Composite ratio.

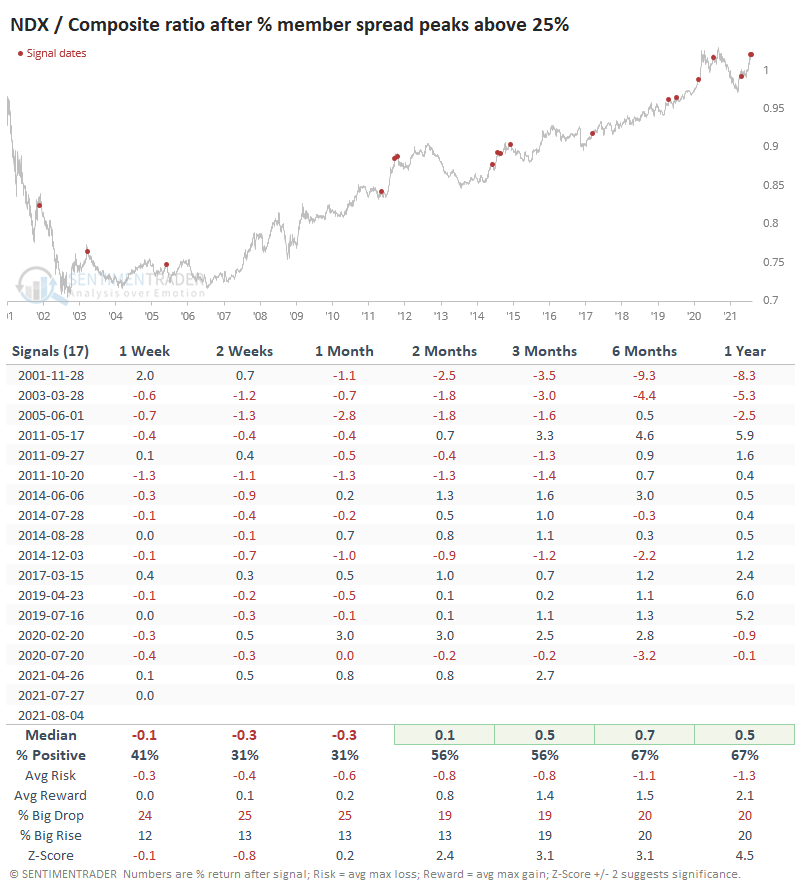
Over the next 2-4 weeks, the Nasdaq 100 tended to lag the broader Composite, with more risk and less reward. But, again, because most of the study period was dominated by a roaring bull market for riskier assets, the medium- to long-term trend tended to favor the 100.

If we assume that these spreads coincide with periods of speculative fervor among investors, then when they've triggered while the S&P 500 was at or near a 52-week high at the time, it preceded some shorter-term trouble. The table below shows returns in the S&P 500 after the same signals but filters out the few signals that triggered when the S&P was not at or near a 52-week high.

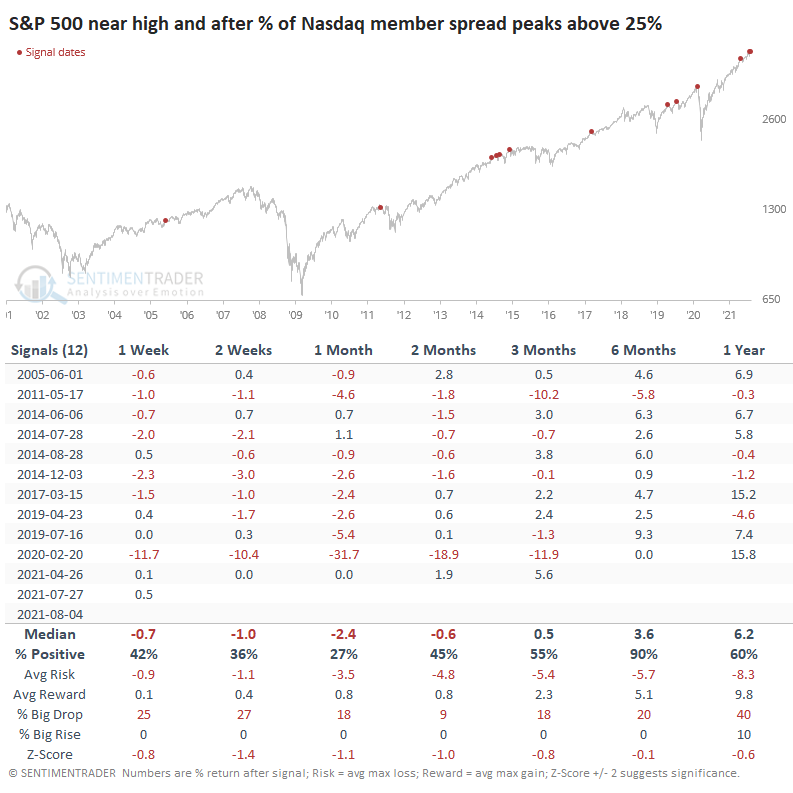
Over the next month, the S&P managed to show a positive return after only 3 of the 12 signals, and 2 of those were just barely. The other one quickly turned into a loss. The S&P's returns across all time frames were below average, with a  poor risk/reward ratio.

Most of the losses were relatively tame, with the biggest exception being the one that triggered near the peak before the pandemic. The persistency of the price trend in 2021 is nearing all-time great status, and trends like that usually don't just collapse. An exogenous event can do it, but typically they meander along until deterioration under the surface gets to be too much for the index itself to maintain. There are some signs of that occurring now and have been for weeks, if not months. It's a yellow flag for markets.

Sorry, you don't have access to this report

Upgrade your subscription plan to get access
Go to Dasboard
DATA &
TECHnologies
IndicatorEdge
‍
BackTestEdge
‍
Other Tools
‍
DataEdge API
RESEARCH
reports
Research Solution
‍
Reports Library
‍
actionable
Strategies
Trading Strategies
‍
Smart Stock Scanner
‍
FREE
RESOUrCES
Simple Backtest
Calculator
Simple Seasonality
Calculator
The Kelly Criterion
Calculator
Sentiment Geo Map
‍
Public Research Reports
‍
Free Webinar
COMPANY
‍
About
‍
Meet our Team
‍
In the News
‍
Testimonials
‍
Client Success Stories
Pricing
Bundle pricing
‍
Announcements
‍
FAQ
© 2024 Sundial Capital Research Inc. All rights reserved.
Setsail Marketing
TermsPrivacyAffiliate Program
Risk Disclosure: Futures and forex trading contains substantial risk and is not for every investor. An investor could potentially lose all or more than the initial investment. Risk capital is money that can be lost without jeopardizing ones’ financial security or life style. Only risk capital should be used for trading and only those with sufficient risk capital should consider trading. Past performance is not necessarily indicative of future results.

Hypothetical Performance Disclosure: Hypothetical performance results have many inherent limitations, some of which are described below. No representation is being made that any account will or is likely to achieve profits or losses similar to those shown; in fact, there are frequently sharp differences between hypothetical performance results and the actual results subsequently achieved by any particular trading program. One of the limitations of hypothetical performance results is that they are generally prepared with the benefit of hindsight. In addition, hypothetical trading does not involve financial risk, and no hypothetical trading record can completely account for the impact of financial risk of actual trading. for example, the ability to withstand losses or to adhere to a particular trading program in spite of trading losses are material points which can also adversely affect actual trading results. There are numerous other factors related to the markets in general or to the implementation of any specific trading program which cannot be fully accounted for in the preparation of hypothetical performance results and all which can adversely affect trading results.

Testimonial Disclosure: Testimonials appearing on this website may not be representative of other clients or customers and is not a guarantee of future performance or success.