
The surprising cyclicality of the biotech sector

Key points
- The biotech sector has shown consistent cyclicality in the past 22 years
- Seasonality is usually best not used as a standalone trading model - still, it has been quite helpful to biotech traders who follow the cycles
- Biotech just entered one of three notable seasonally favorable periods
The annual seasonal trend for IBB
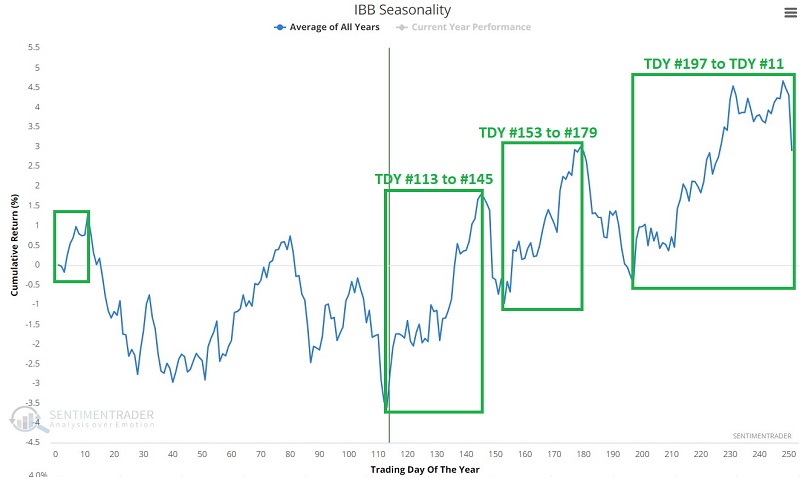
The chart below displays the annual seasonal trend for the iShares Biotechnology ETF (ticker IBB).
Note that there are three distinct favorable periods within the calendar year.
- TDY (Trading Day of Year) #113 through TDY #145
- TDY #153 to TDY #179
- TDY #197 to TDY #11 (of the next year)
How meaningful are these distinctions? Let's assess IBB's performance in the past 22+ years.
TDY #113 through #145
The chart below displays the growth of $1 if held in IBB only from the close of TDY #113 through TDY #145 each year since 2001. The cumulative gain equals +169%. For 2023, this period extends from the close on 2023-06-14 through the close on 2023-08-02.

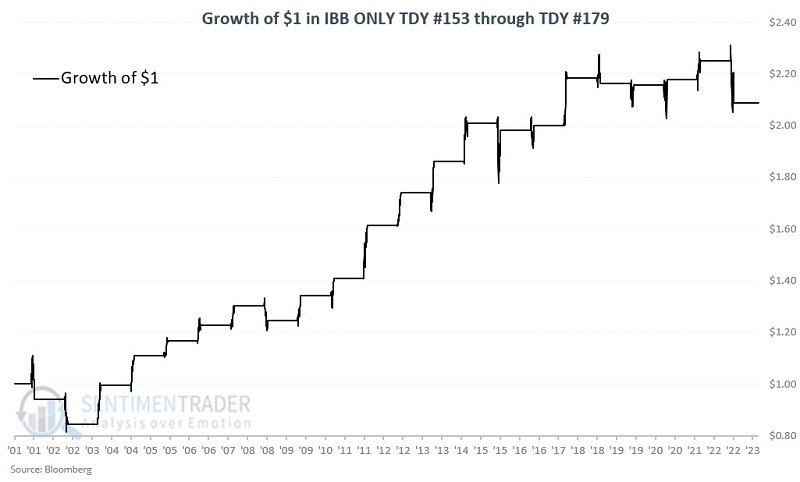
TDY #153 through #179
The chart below displays the growth of $1 if held in IBB only from the close of TDY #153 through TDY #179 each year since 2001. The cumulative return equals +109%. For 2023, this period extends from the close on 2023-08-14 through the close on 2023-09-20.
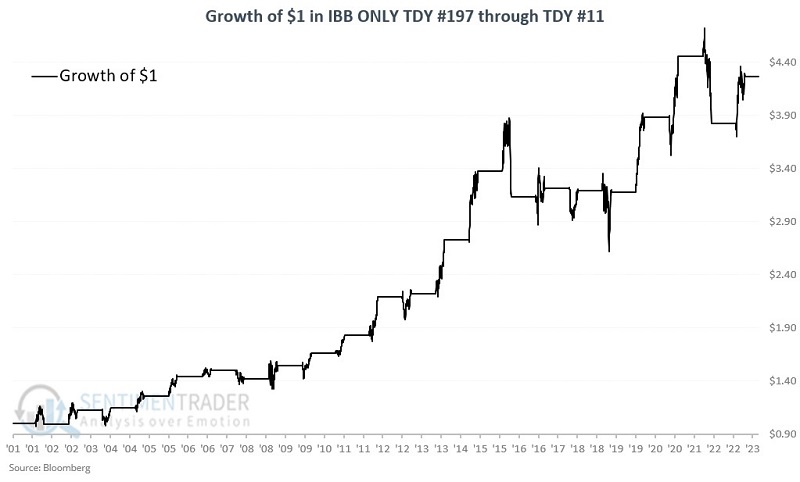
TDY #197 through #11
The chart below displays the growth of $1 if held in IBB only from the close of TDY #197 through TDY #11 of the following year each year since 2001. The cumulative gain equals +326%. For 2023-24, this period extends from the close on 2023-10-16 through the close on 2024-01-17.
Combining favorable periods
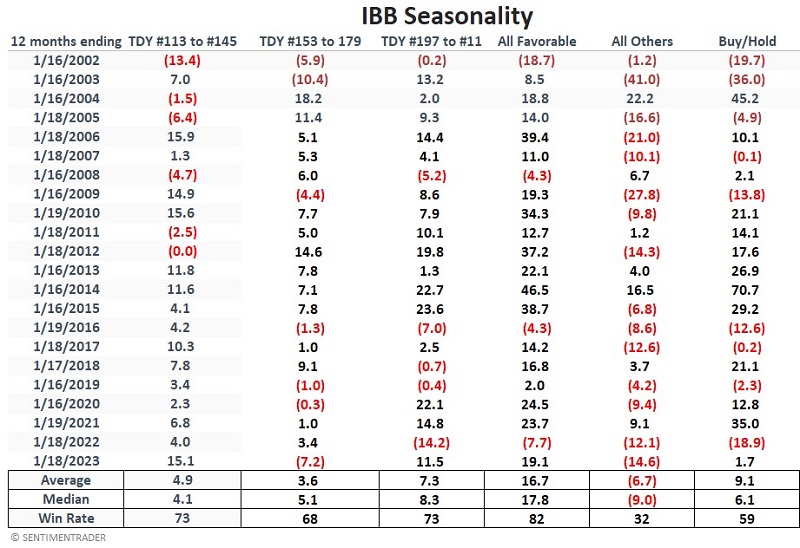
As you can see in the charts above, none of these periods are ever a "sure thing." As shown in the table below, WIn Rates for these three periods range from 68% to 73%, so one never knows if a supposedly "favorable" period will show a gain in any given year. Still, in combination, there does appear that have some potential value.
The chart below assumes a trader held IBB only during the three favorable seasonal periods highlighted above every year since 2001. The cumulative hypothetical gain is +2,294% versus +286% for a buy-and-hold approach.

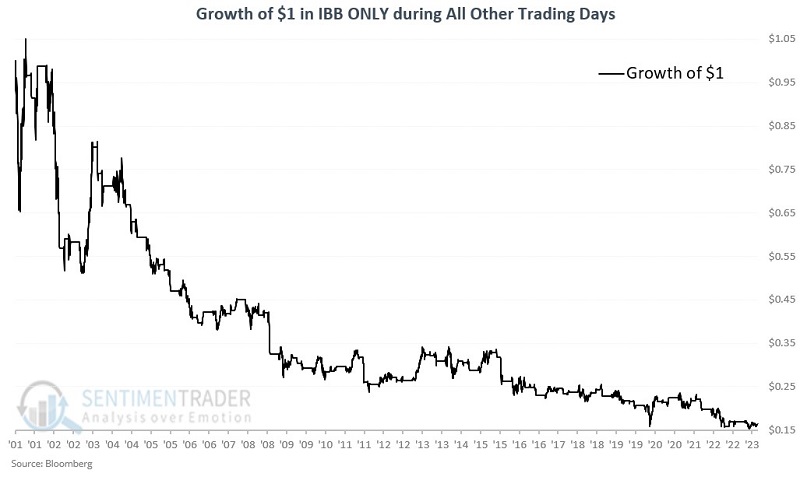
Combining non-favorable periods
Let's focus solely on the non-favorable periods. The chart below assumes a trader held IBB during all trading days since 2001 that did not fall within one of the three favorable periods highlighted above. Strong rallies are not uncommon during these periods. Nevertheless, the long-term trend is unmistakable. The hypothetical cumulative return is -84%.
Summary of results
The chart below displays the growth of $1 held in IBB only during the three favorable periods highlighted above, divided by the growth of $1 held in IBB on a buy-and-hold basis.

The table below summarizes IBB's performance during all periods discussed above.
Some thoughts on real-world trading
The real question is, "What to do with this information?" The abovementioned seasonal approach has vastly outperformed buy-and-hold as a hypothetical standalone trading model. So, some might consider using a reasonable portion of investment capital to hold a long position during the three favorable seasonal periods. In this case, there are two things to keep in mind:
- There is no guarantee whatsoever that future results will resemble past results
- There is a question of drawdowns
In the interest of "keeping it real" and to highlight the potential dangers in relying on seasonality as a standalone trading method, note in the drawdown chart below that the "systematic" approach of holding IBB only during the three favorable seasonal periods each year witnessed a -32% maximum drawdown in the 2000-2002 bear market and three other separate drawdowns over -19% since.
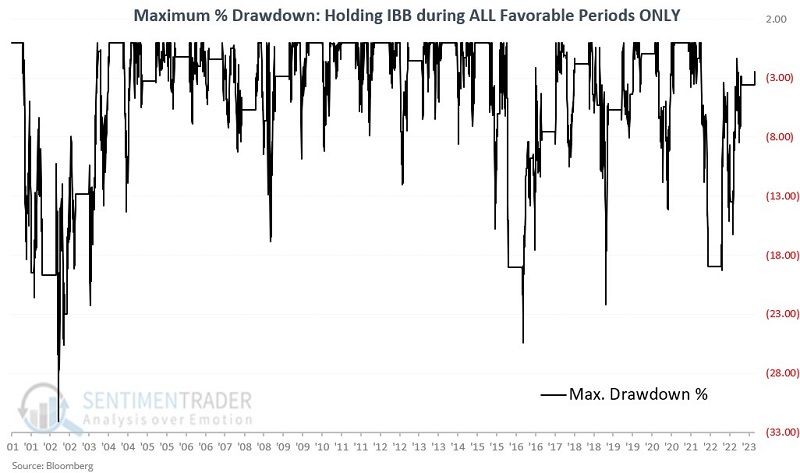
Whether you can - or even should - hold on through drawdowns of this magnitude is a question each trader must answer for themselves. One possibility (for this or any other volatile strategy) is to allocate a relatively small portion of one's total trading capital. A 30% drawdown on an allocation of 10% of total trading capital amounts to a decline of -3% of total trading capital, which might make it more palatable.
Another possibility for traders is to "favor the long side" of IBB during the favorable seasonal periods and "favor the short side" during all other periods. This application would involve a trader applying other indicators that they favor (chart patterns, technical indicators, etc.) to trigger an actual "buy" signal within one of the seasonally favorable periods (or an actual "sell short" signal within one of the non-favorable periods). The trader would also be responsible for capital allocation and position management decisions.
What the research tells us…
There is a right way and a wrong way to use seasonality. As compelling as the results above may be, I rarely advocate holding (or not holding) something solely because of the date on the calendar. If such an approach is undertaken, it is prudent to do so with only a small capital allocation. Generally speaking, seasonality is best used to tell a trader or investor "where to look" and "which way to lean." With a favorable period in play, it might make sense to consider an allocation to the biotech sector between now and early August. However, assuming that IBB is sure to rally during this time would be a mistake.