
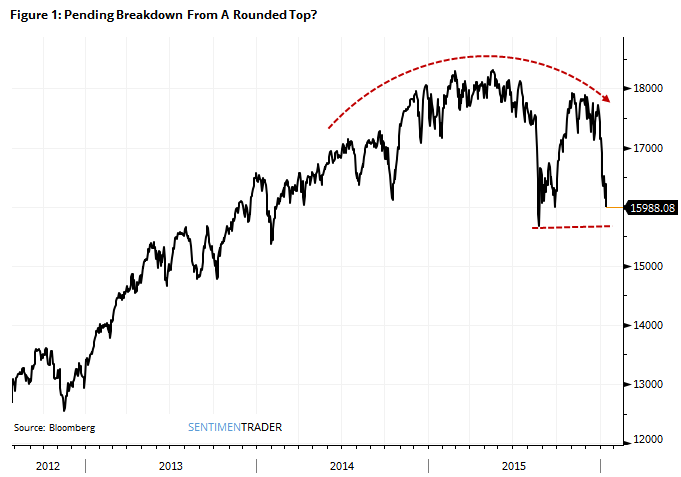
About That Rounded Top

A big concern among technically-oriented traders is what looks to be a pending breakdown from a rounded top formation. Many also point out a potential head-and-shoulders formation.
Technical analysis has never proven to be consistently predictive, partly because it is subjective. There are a lot of "it looks like..." types of statements when discussing formations, making it difficult to quantify and test.
That doesn't mean it isn't without merit. The whole point of that branch of analysis is a focus on what is happening right now, without the assumptions and forecasts that fundamental analysts make. So in terms of stripping away a lot of B.S., technical analysis serves a purpose.
Should we be concerned if stocks break down? After all, we saw a similar pattern play out in 2000 and 2008. Stocks rose for years, suffered a volatile back-and-forth few months, then broke down and fell into bear markets.
We are conditioned to put the most weight on recent occurrences, which is valid up to a point. Past that point, we become blinded to other possibilities.
Let's go back as far as we can, to 1896, and look objectively for other instances like we're seeing now, and in 2000 and 2008. We're looking for rising prices for a year or more, followed by a rounded-top, head-and-shoulders type of formation.
This is inherently subjective, but I've been studying chart formations for 25 years. Even so, anyone with even 5 minutes of instruction on what to look for should point out most of the same time periods.
Figure 2 shows every similar occurrence in the past 120 years. There is a "Before" snapshot, and try to look at that first. Look at the far right edge of the chart and think about how scary it must have felt if you were experiencing it in real-time.
The "After" snapshot extends the chart out over the next 2-3 years, so we can see the implication if we had sold when stocks broke down.
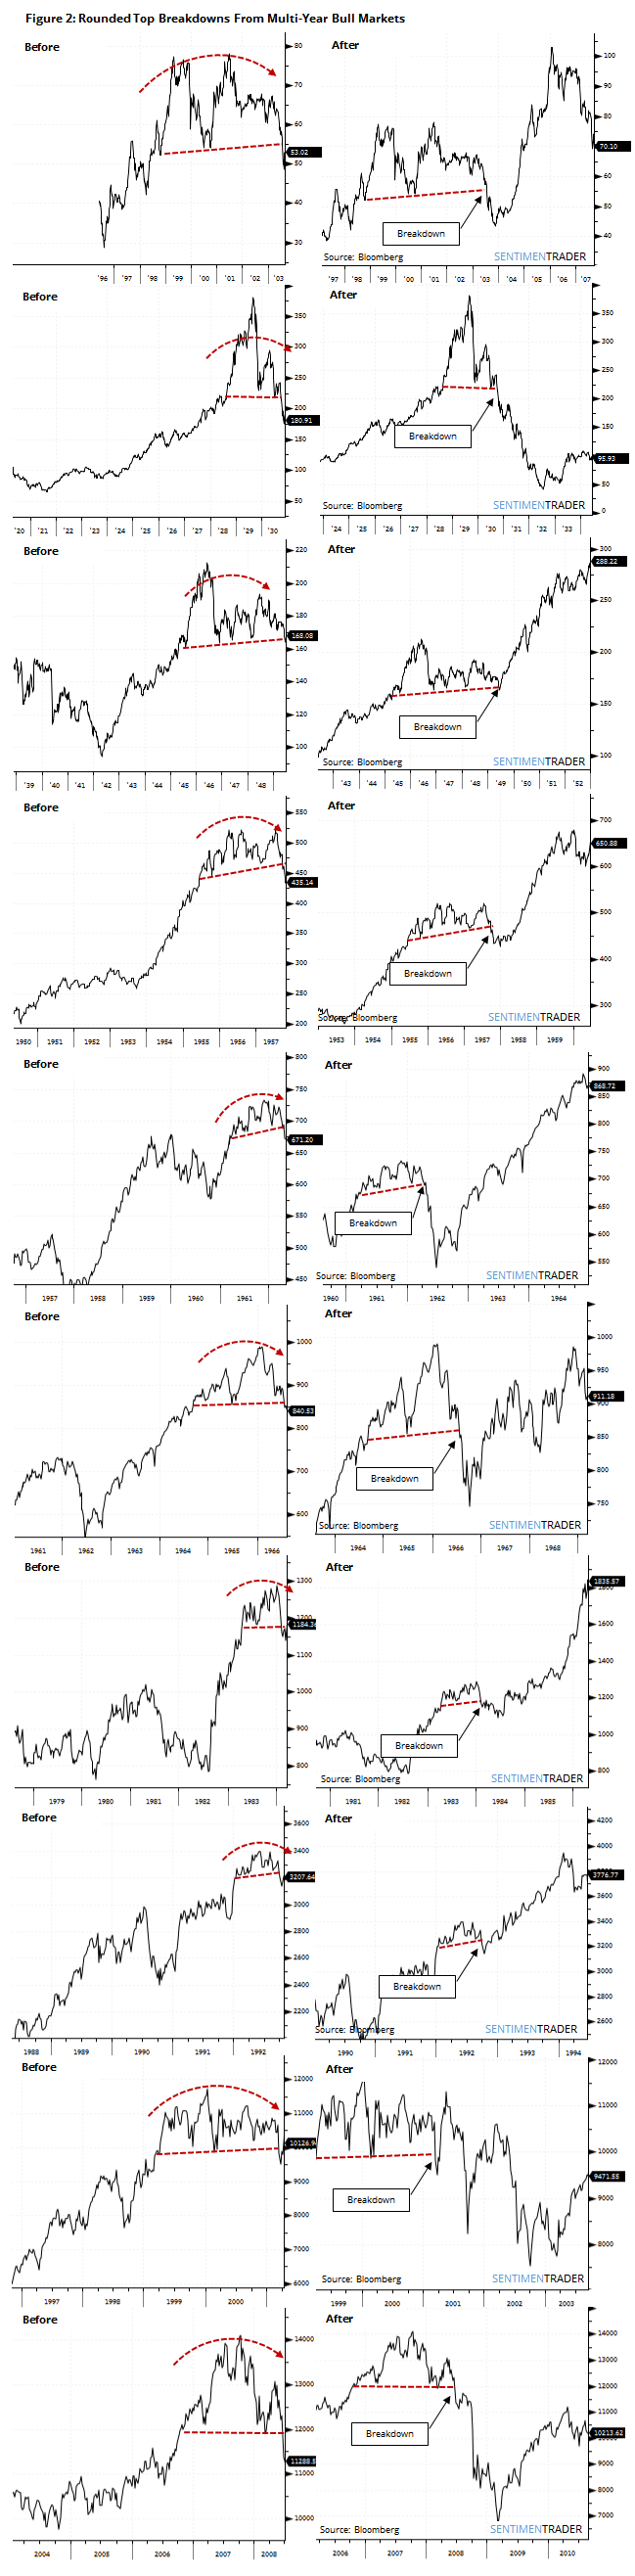
We would have felt really good about ourselves in 1930, 2001 and 2008 as stocks collapsed. We would have temporarily felt good in 1903, 1957, 1962, 1966 and 1984. We would have felt pretty stupid about panicking in 1949 and 1992 as stocks bottomed almost immediately and roared to new highs.
The "temporarily smart" instances, which comprised most of them, fell an additional 10%-20% from the breakdown point over the next 2-6 months (generally).
The most consistent factor among the worst losses was persistent selling pressure from the breakdown level. That's the key to watch for - if stocks do break down below the August lows, and buyers show no interest in stepping in, then it makes sense to expect even more pain in the months ahead.
But a multi-year bear market that erases 40%-60% of market value? Not likely, especially if relying on some picture of a chart that happens to look like a couple of recent occurrences.