Products
SentimenTrader Trading Tools
‍
Backtest Engine
My Trading Toolkit
Correlation Analysis
Seasonality
Indicators & Data API
‍
Proprietary Indicators & Charts
Market Data API
Strategies & Scanner
‍
50+ Trading Strategies
Smart Stock Scanner
Research Reports
‍
Research Solutions
Reports Library
Free Resources
Simple Backtest Calculator
Simple Seasonality Calculator
The Kelly Criterion Calculator
Sentiment Geo Map
Public Research Reports
Pricing
Company
About
In the News
Testimonials
Client Success Stories
Contact
Log inLoginSign up
< BACK TO ALL REPORTS

A bullish long-term trend backdrop for the Consumer Discretionary sector

Dean Christians
2023-07-12
The percentage of Consumer Discretionary stocks with a rising 200-day average increased above 88%. After similar conditions, the Discretionary sector was higher a year later in all but one case. When medium and long-term breadth indicators align like now, the sector was higher a year later every time.

Key points:

  • The percentage of Consumer Discretionary stocks with a rising 200-day average increased above 88%
  • After similar trend conditions, the S&P 500 Discretionary sector was higher a year later, 93% of the time 
  • When medium and long-term breadth indicators rise in unison, the sector was higher every time a year later

Never count the consumer out

Just this morning, I heard a commentator on TV say they wished the market would broaden out, so it wasn't just Amazon and Apple driving the indices. While that may have been the case a few months ago, participation from other stocks has taken a notable turn higher, as I highlighted in a recent note focusing on the Industrials sector.

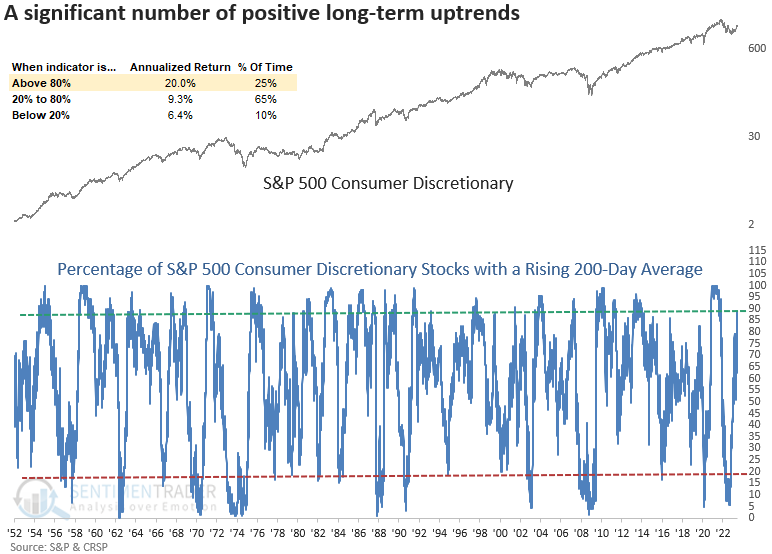
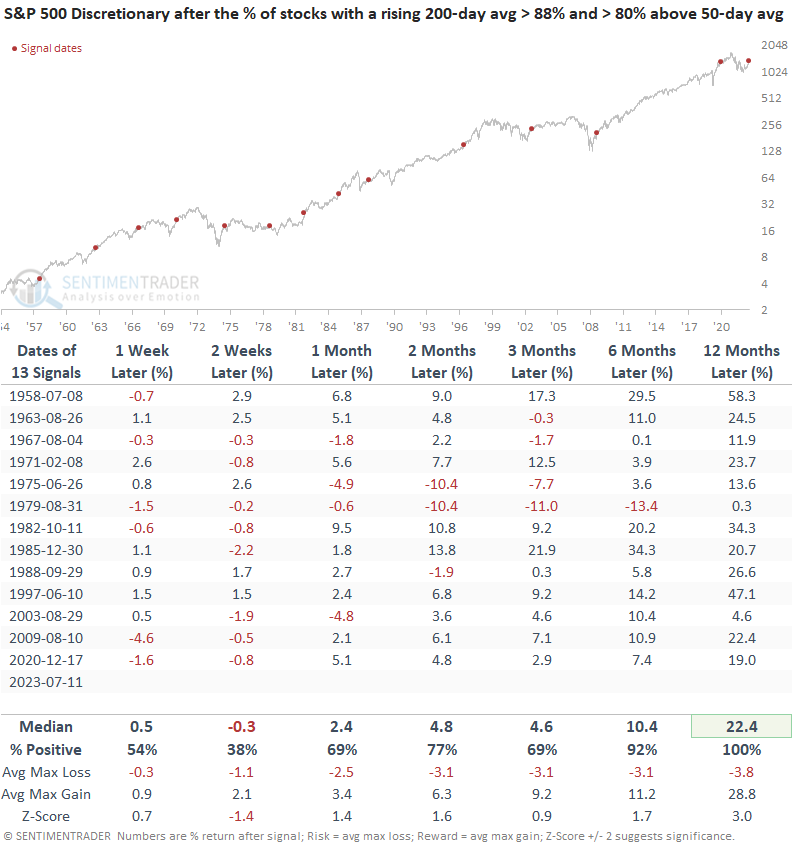
On Tuesday, the percentage of S&P 500 Consumer Discretionary stocks with a rising 200-day average increased above 88%, reaching the highest level since November 2021.

Annualized returns are excellent when a high level of Discretionary stocks are in a long-term uptrend like now.

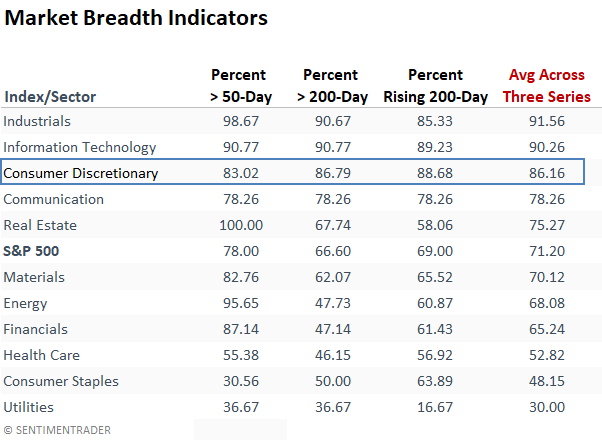
The Consumer Discretionary sector maintains the second highest level of stocks with a rising 200-day average, trailing only Technology. 

Amazon and Tesla represent 2 out of 53 stocks in the sector. So, there are plenty of other opportunities.  

Similar long-term uptrend conditions preceded positive returns

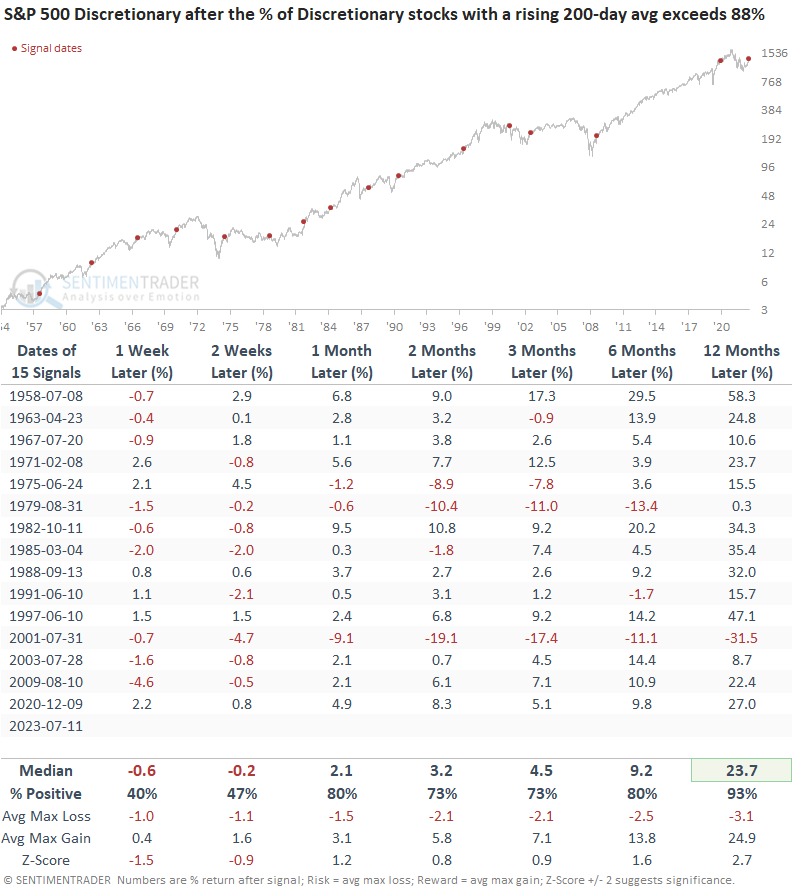
Historically, when the percentage of S&P 500 Consumer Discretionary sector stocks with a rising 200-day average exceeds 88%, the sector was higher a year later in all but one precedent. The only time a signal occurred in a bear market was in 2001, which was an unusual period as most stocks maintained uptrends as Technology cratered, dragging cap-weighted indexes like the S&P 500 lower.

Additional context

When I reviewed the whipsaw signal in 2001, I noticed that short to medium-term breadth indicators had deteriorated to lower levels just as the percentage of Discretionary stocks with a rising 200-day average increased above 88%. However, that's not the case now, as more than 83% of Discretionary stocks are trading above their 50-day average.

Let's add a condition to the original study that requires more than 80% of Discretionary stocks to close above their 50-day average, as over 88% maintain a rising 200-day average.

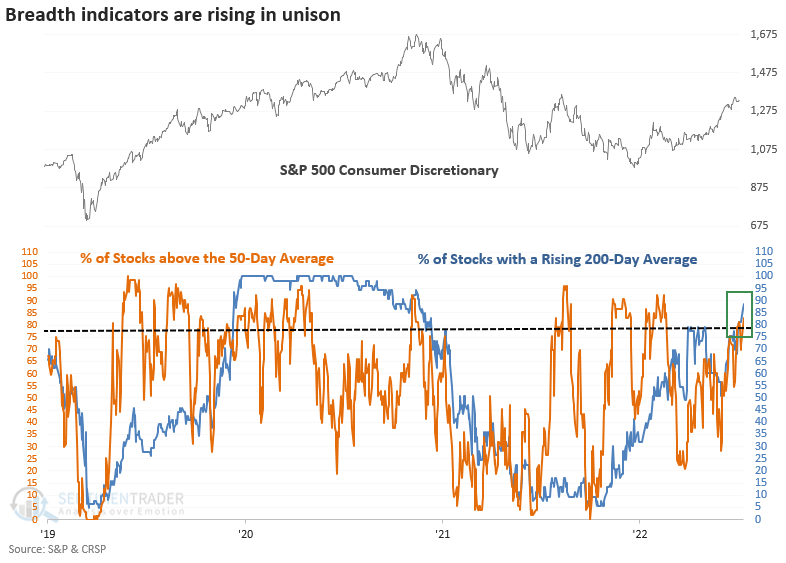
With the simultaneous increase in market breadth indicators across different time intervals, the chances of a downturn resembling 2001 look less likely. A year later, the Discretionary sector and the S&P 500 were higher every time. When Consumer Discretionary stocks are in long-term uptrends like now, it's bullish for the overall market.

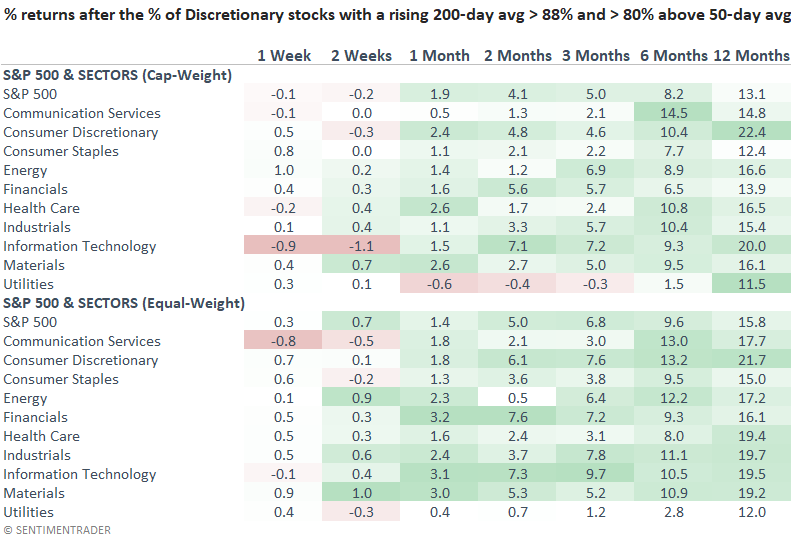
Consumer Discretionary and Technology, two growth-oriented sectors, have historically provided the best opportunity, which aligns with current relative strength trends. 

What the research tells us...

Given that consumption expenditures account for the largest proportion of GDP, the Consumer Discretionary sector is a critical group to monitor for insights regarding the health of the stock market and the economy.
With a significant number of Consumer Discretionary stocks in medium and long-term uptrends, the outlook for the sector and the broad market look bright, especially a year later.

Sorry, you don't have access to this report

Upgrade your subscription plan to get access
Go to Dasboard
PRODUCTS
SentimenTrader
Trading Tools
Indicators & Data API
‍
Strategies & Scanner
‍
Research Reports
FREE
RESOUrCES
Simple Backtest
Calculator
Simple Seasonality
Calculator
The Kelly Criterion
Calculator
Sentiment Geo Map
‍
Public Research Reports
‍
Pricing
Bundle pricing
‍
Announcements
‍
FAQ
COMPANY
‍
About
‍
In the News
‍
Testimonials
‍
Client Success Stories
CONTACT
‍
General Inquiries
‍
Media Inquiries
‍
Financial Professionals Inquiries
‍
© 2025 Sundial Capital Research Inc. All rights reserved.
Setsail Marketing
TermsPrivacyAffiliate Program
Risk Disclosure: Futures and forex trading contains substantial risk and is not for every investor. An investor could potentially lose all or more than the initial investment. Risk capital is money that can be lost without jeopardizing ones’ financial security or life style. Only risk capital should be used for trading and only those with sufficient risk capital should consider trading. Past performance is not necessarily indicative of future results.

Hypothetical Performance Disclosure: Hypothetical performance results have many inherent limitations, some of which are described below. No representation is being made that any account will or is likely to achieve profits or losses similar to those shown; in fact, there are frequently sharp differences between hypothetical performance results and the actual results subsequently achieved by any particular trading program. One of the limitations of hypothetical performance results is that they are generally prepared with the benefit of hindsight. In addition, hypothetical trading does not involve financial risk, and no hypothetical trading record can completely account for the impact of financial risk of actual trading. for example, the ability to withstand losses or to adhere to a particular trading program in spite of trading losses are material points which can also adversely affect actual trading results. There are numerous other factors related to the markets in general or to the implementation of any specific trading program which cannot be fully accounted for in the preparation of hypothetical performance results and all which can adversely affect trading results.

Testimonial Disclosure: Testimonials appearing on this website may not be representative of other clients or customers and is not a guarantee of future performance or success.